This article describes how to use the Monitoring Dashboard.
The Monitoring Dashboard allows administrators and managers to gain visibility about utilizing the various features Harmony SASE offers and visualization of usage, including active sessions, member licenses, gateway licenses, and Zero Trust Applications configured.
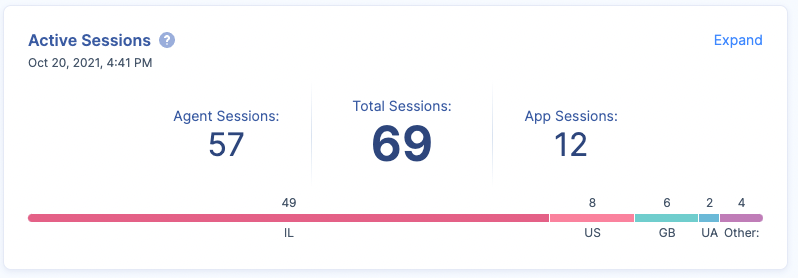
Active Sessions
Agents: Each user connected through an agent is considered an active session.
Applications: Each Zero Trust Application is considered a session.
For example: if a user is connected to the Network with an agent, and has two active ZTA sessions - that’s a total of three active sessions.
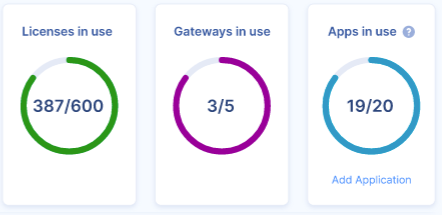
General Information
Member Licenses: Number of utilized user licenses from the purchased amount.
Gateway Licenses: Number of utilized gateway licenses from the purchased amount.
Applications: Number of utilized Zero Trust Applications from the purchased amount.
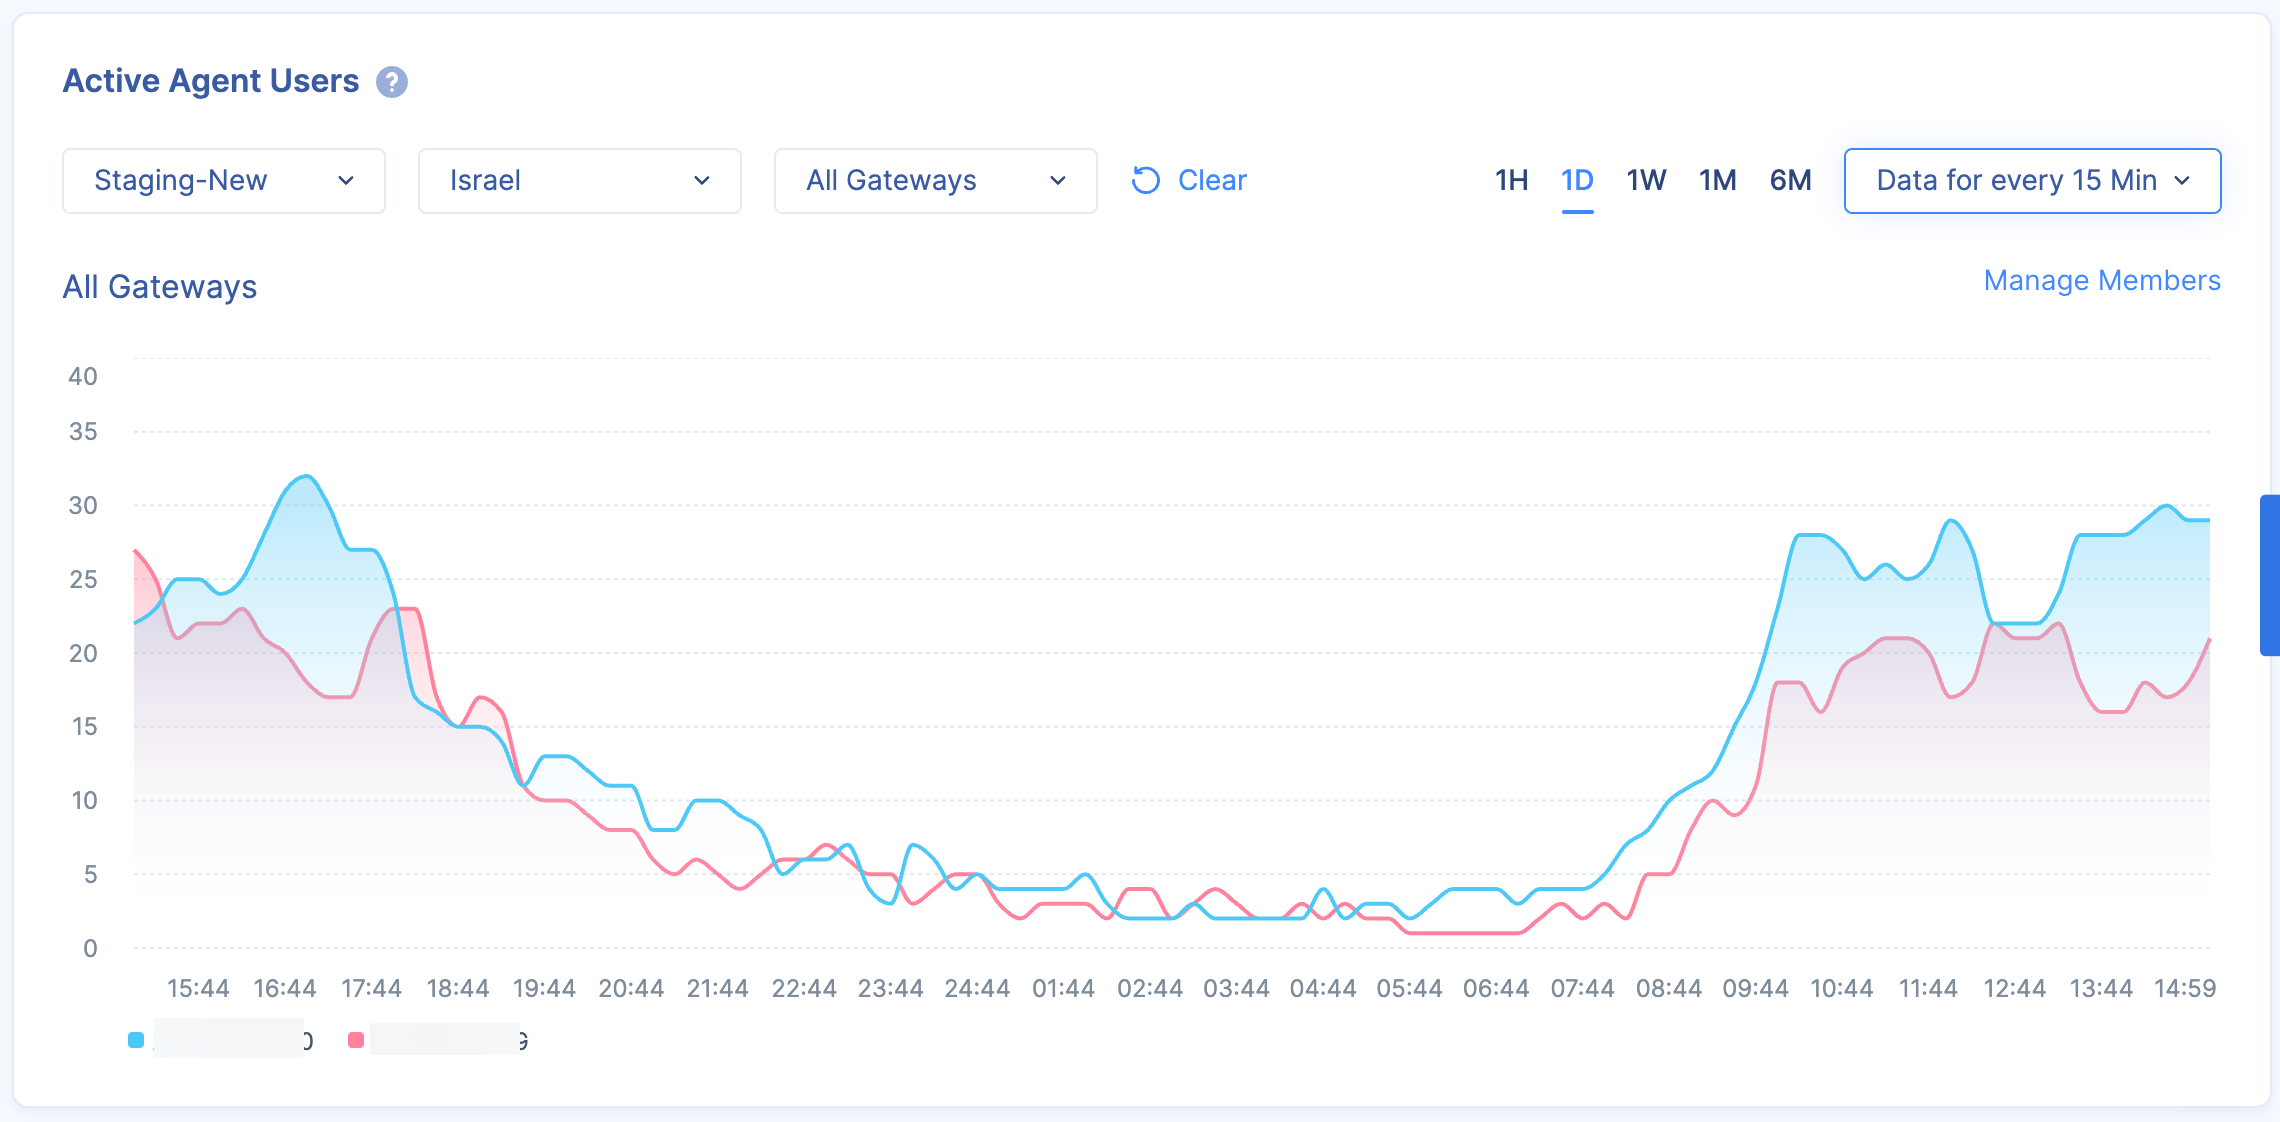
Active Agent Users
Each user connected with an agent is aggregated in this graph, you can change the view based on the Network (Private and Public), Region, Gateway, timeframe, and scale.
For example: gives the administrator the ability to know how many users were connected at a given day/time, on the Network and even Gateway level.
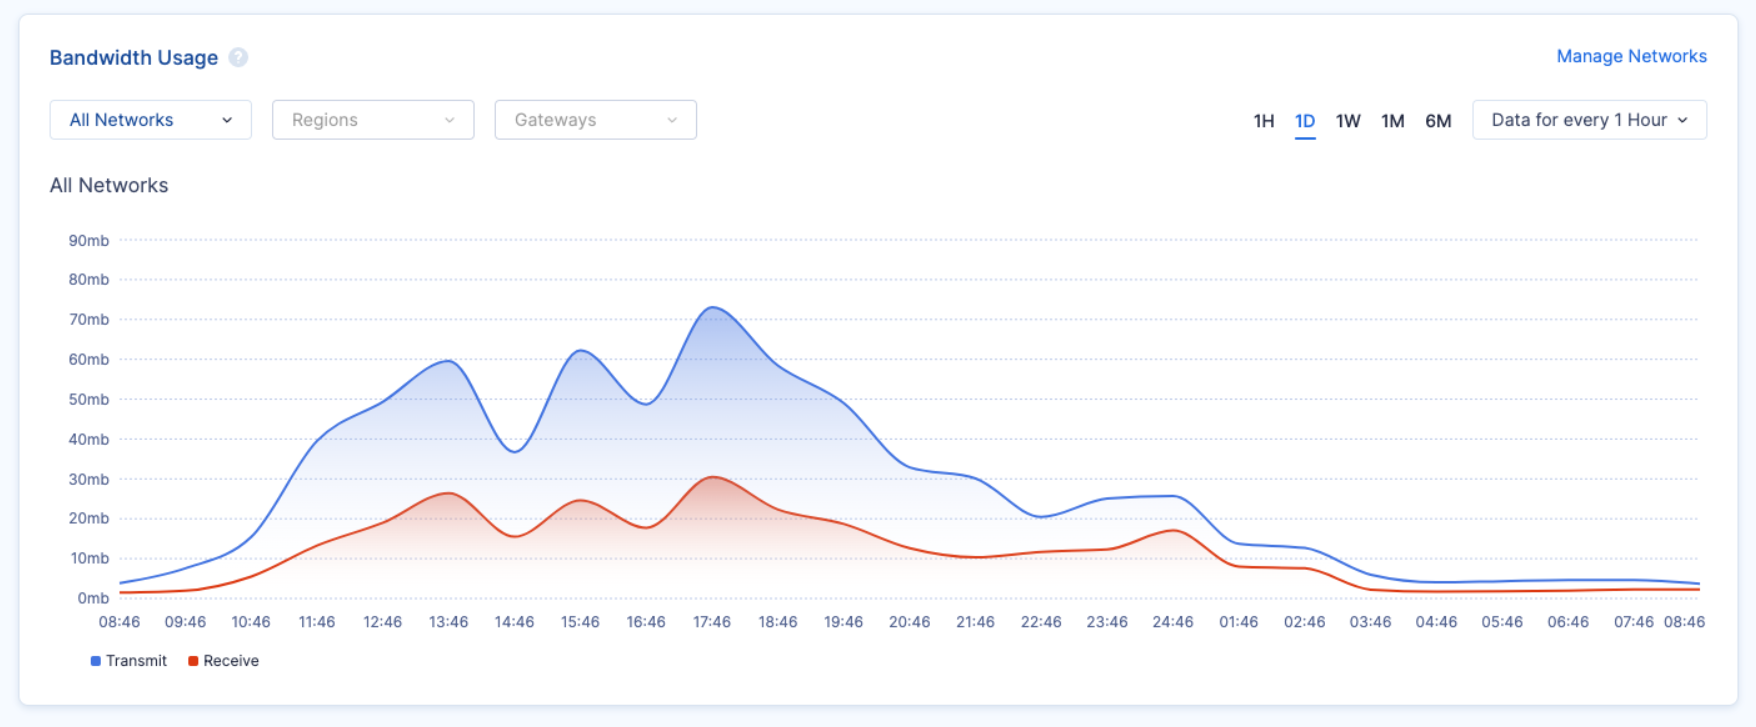
Bandwidth Usage
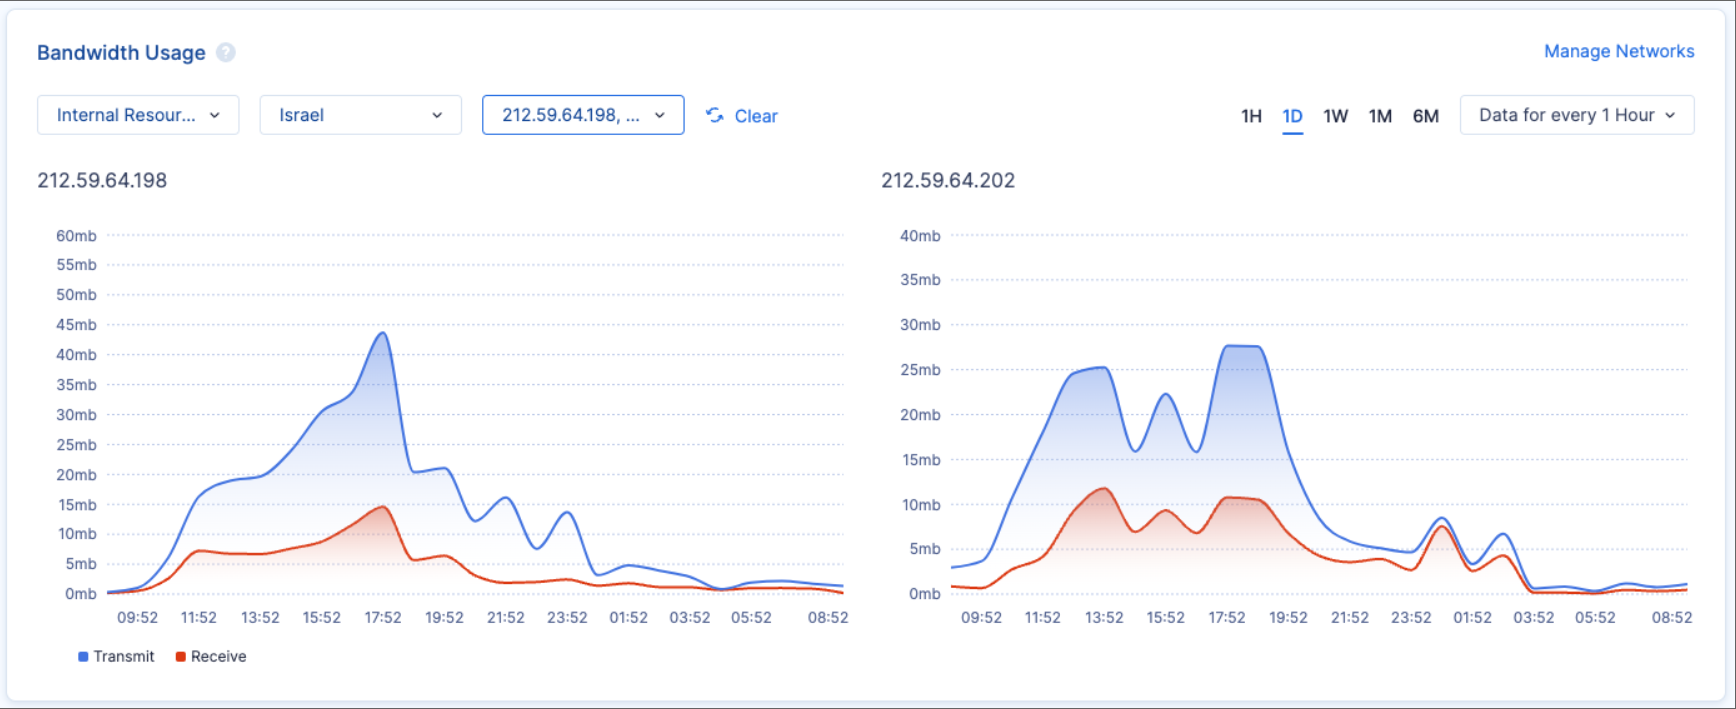
View live and historical gateways' average bandwidth usage information for members connecting through agents at a given day/time, on the Network, and even Gateway level.
Transmit = Data that was transmitted from the Gateways (like download in case it was sent for end-users).
Receive = Data that was passed from the to the Gateway (Upload to the GW).
More viewing functionality:
You can compare up to three gateways in the same view (select a specific network and region and check all the gateways you want to compare (up to 3).
Additional Information
OS Distribution: Shows the various Operating Systems used by the users.
Device Type Distribution: Shows Desktop and Mobile connections.
Agent Version by OS: Shows the version used, divided by OS.

