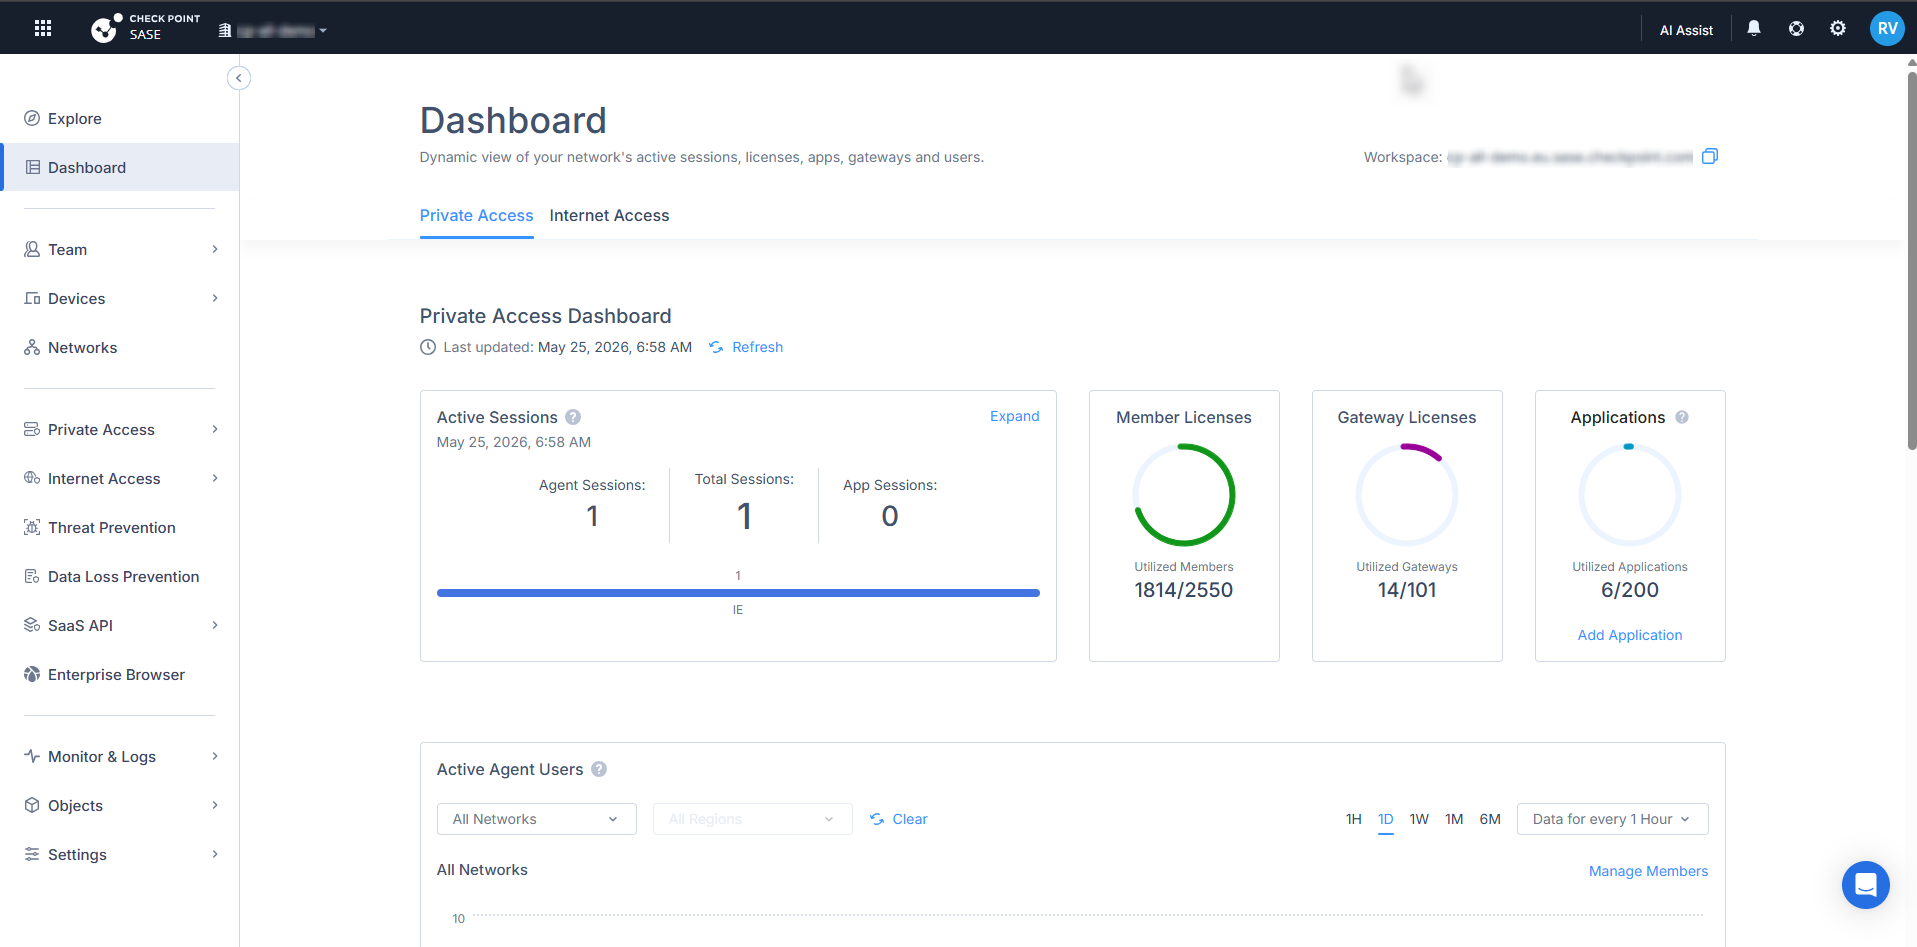
The Dashboard shows usage information for Check Point SASE, including active sessions, member licenses, gateway licenses, and configured Zero Trust Applications.
The Dashboard
To view the page, access Check Point SASE Administrator Portal
Private Access
The Private Access Dashboard shows information related to access to private resources.
Active Sessions
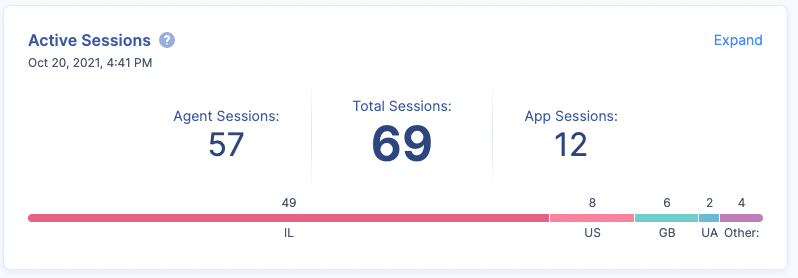
The Active Sessions widget shows:
Agent Sessions: The number of users connected to a network through the Check Point SASE Agent
App Sessions: The number of users accessing the Zero Trust Applications.
Total Sessions: Total number of Agent
For example, if a member is connected to a network through the Check Point SASE Agent
To view the detailed information, click Expand. The system redirects to the
Member Licenses
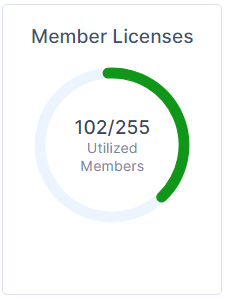
The Member Licenses widget shows the number of member licenses utilized out of the purchased licenses.
Gateway Licenses
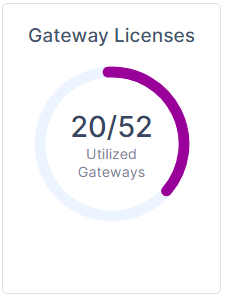
The Gateway
Applications
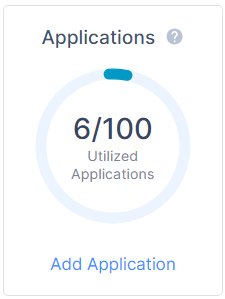
The Applications widget shows the number of applications accessed out of the configured applications.
To add an application, click Add Application. For more information, see
Active Agent Users
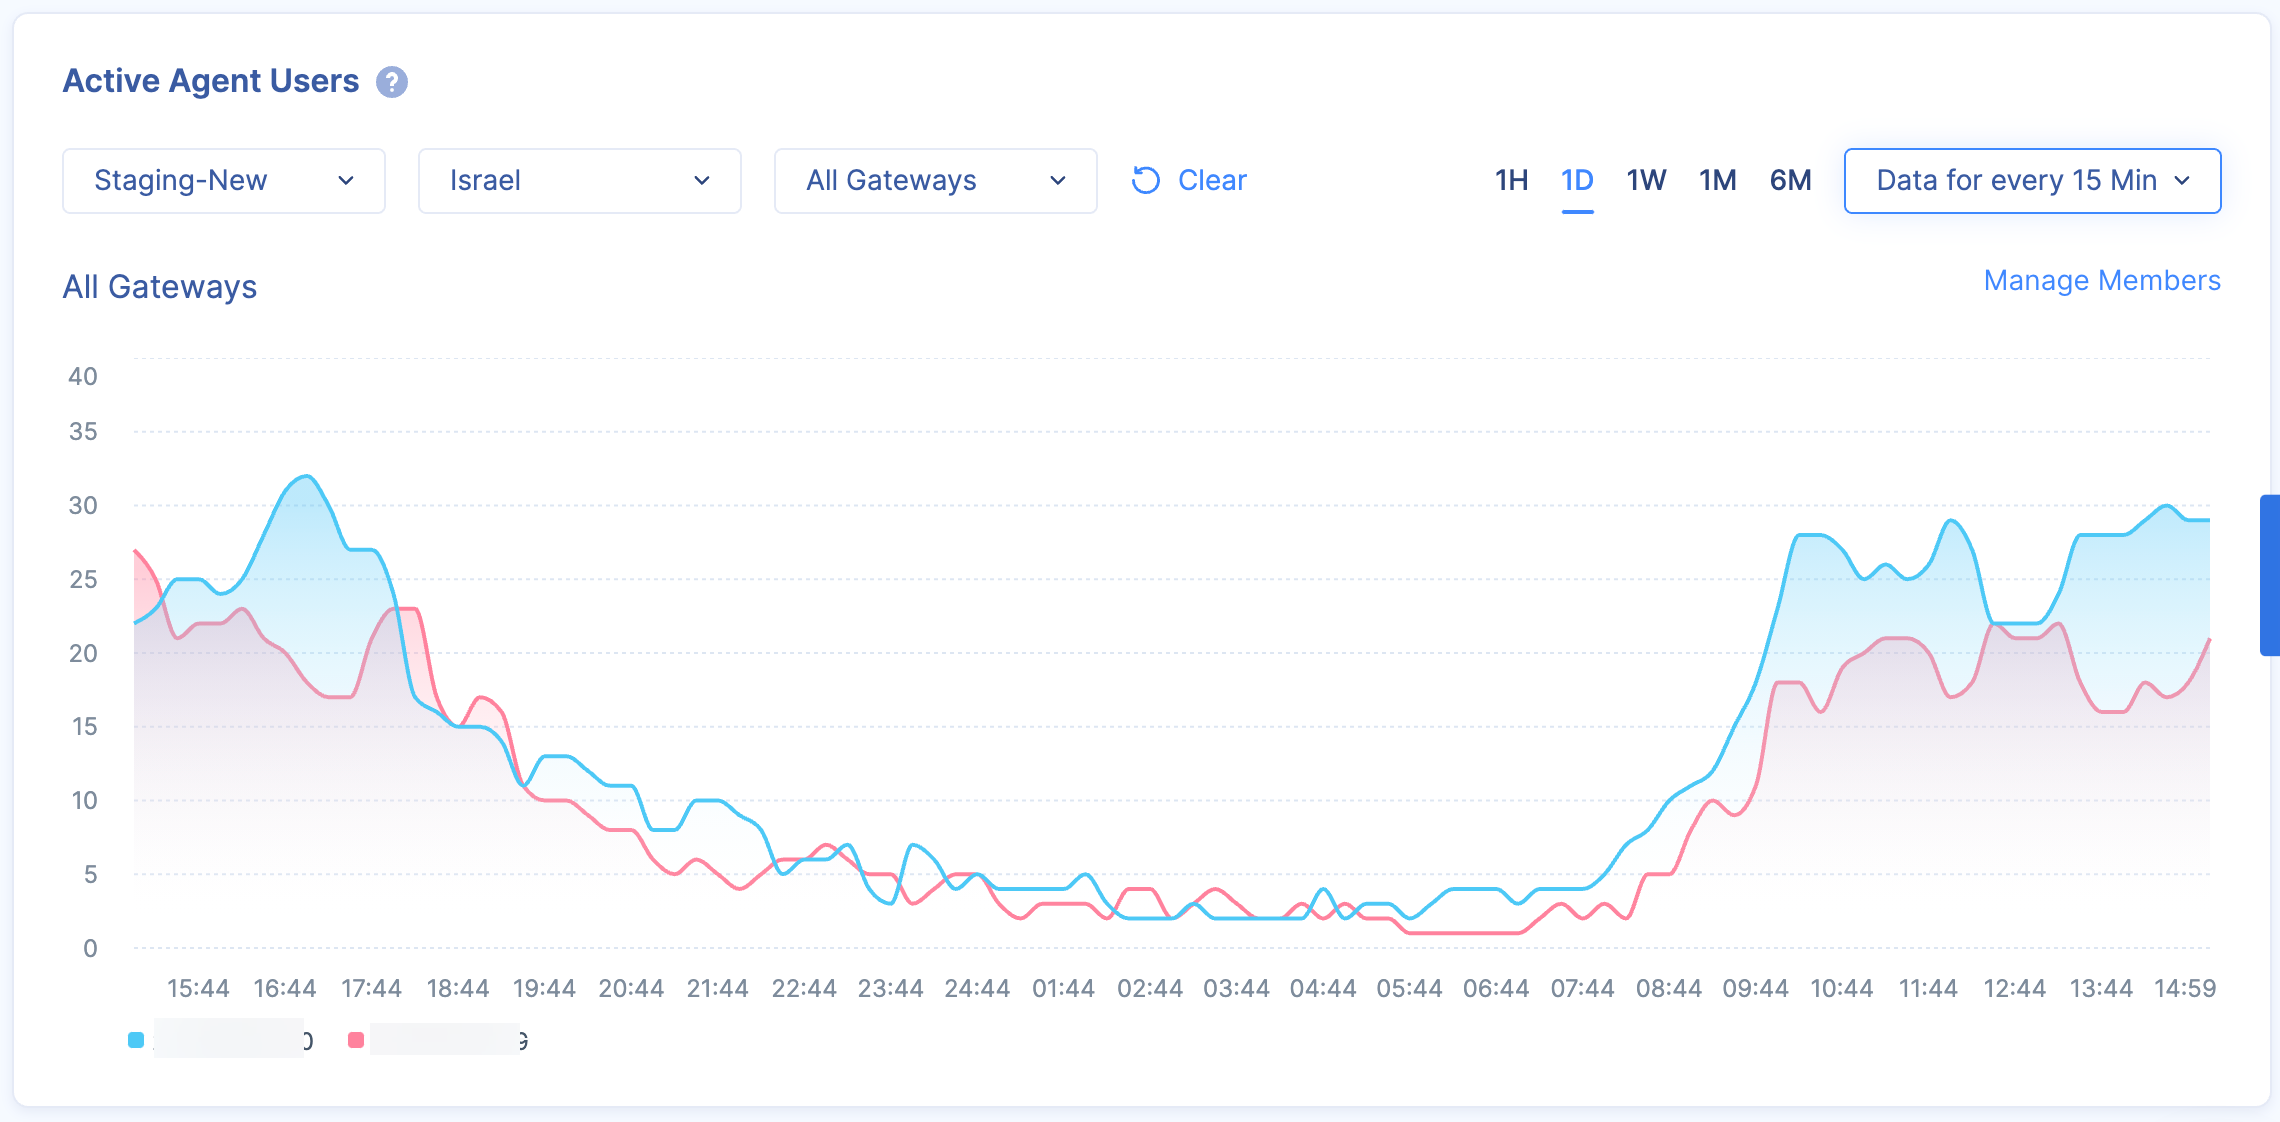
The Active Agent
You can filter the data by Network, Region, Gateway
For a network and region, you can compare the data for up to three gateways
Users Bandwidth
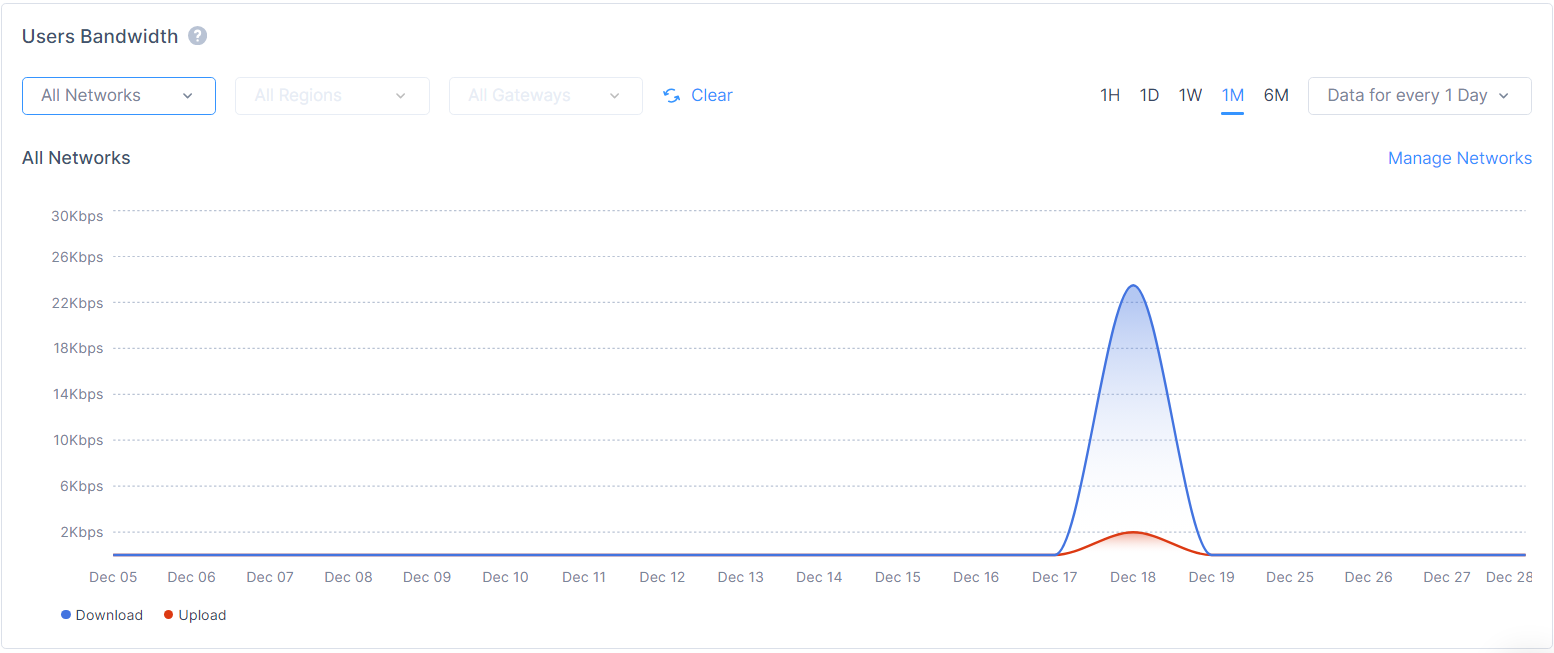
The Users Bandwidth widget shows the live and historical bandwidth used (upload and download) by members connected to the Check Point SASE Agent
You can filter the data by Network, Region,
For a network and region, you can compare the data for up to three gateways
OS Distribution
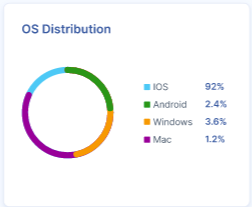
The OS Distribution widget shows the distribution of devices by operating systems
Device Type Distribution
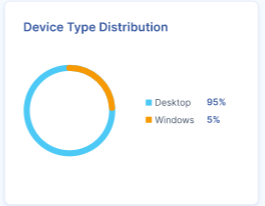
The Device Type Distribution widget shows the distribution of devices by type.
Version by OS
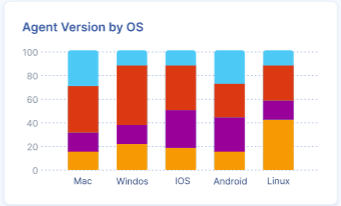
The Agent
Internet Access
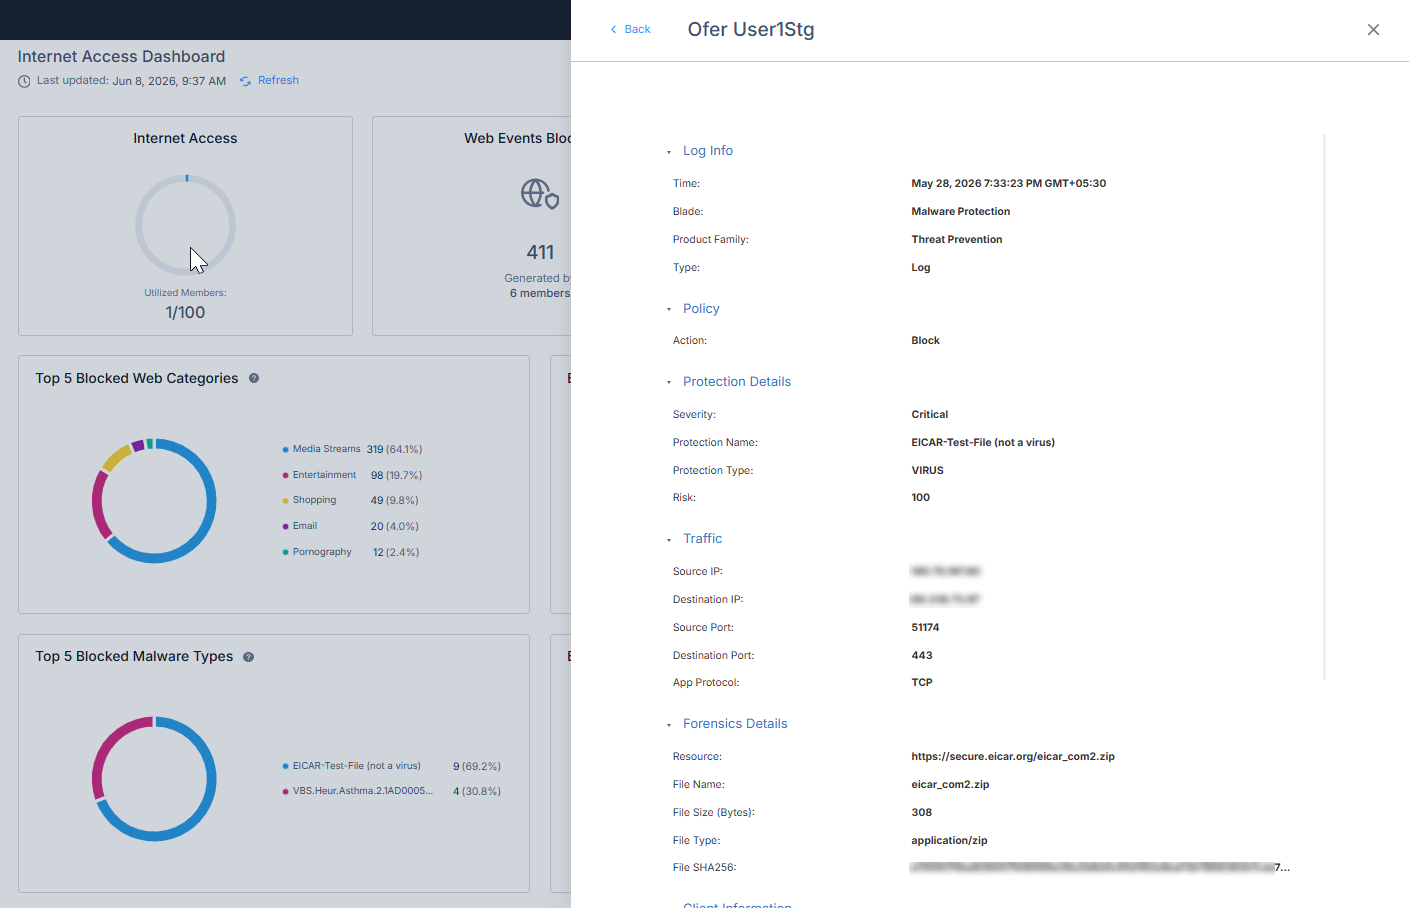
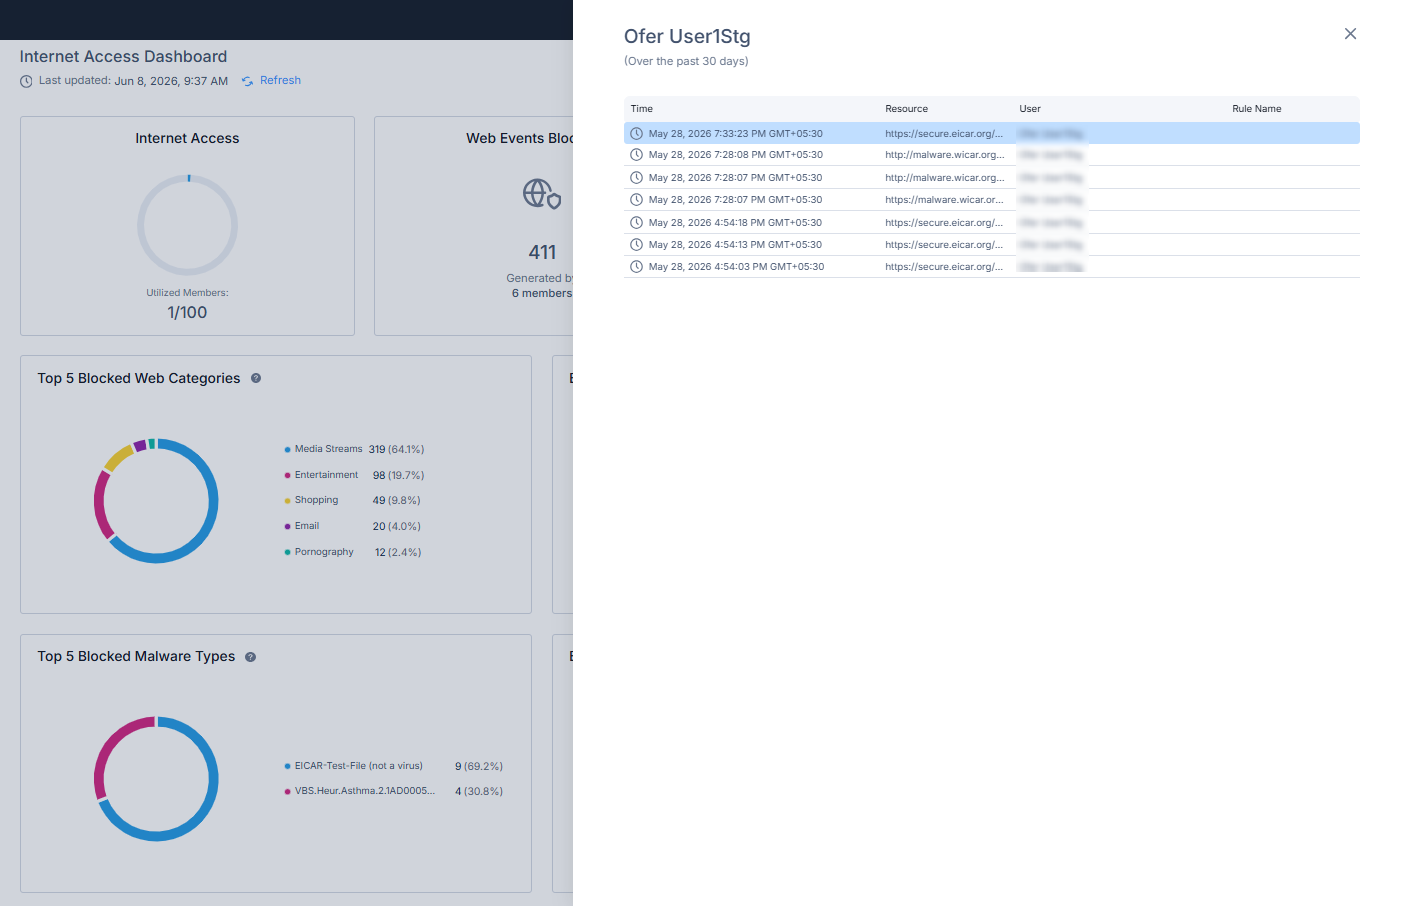
The Internet Access Dashboard shows information related to secure Internet access.
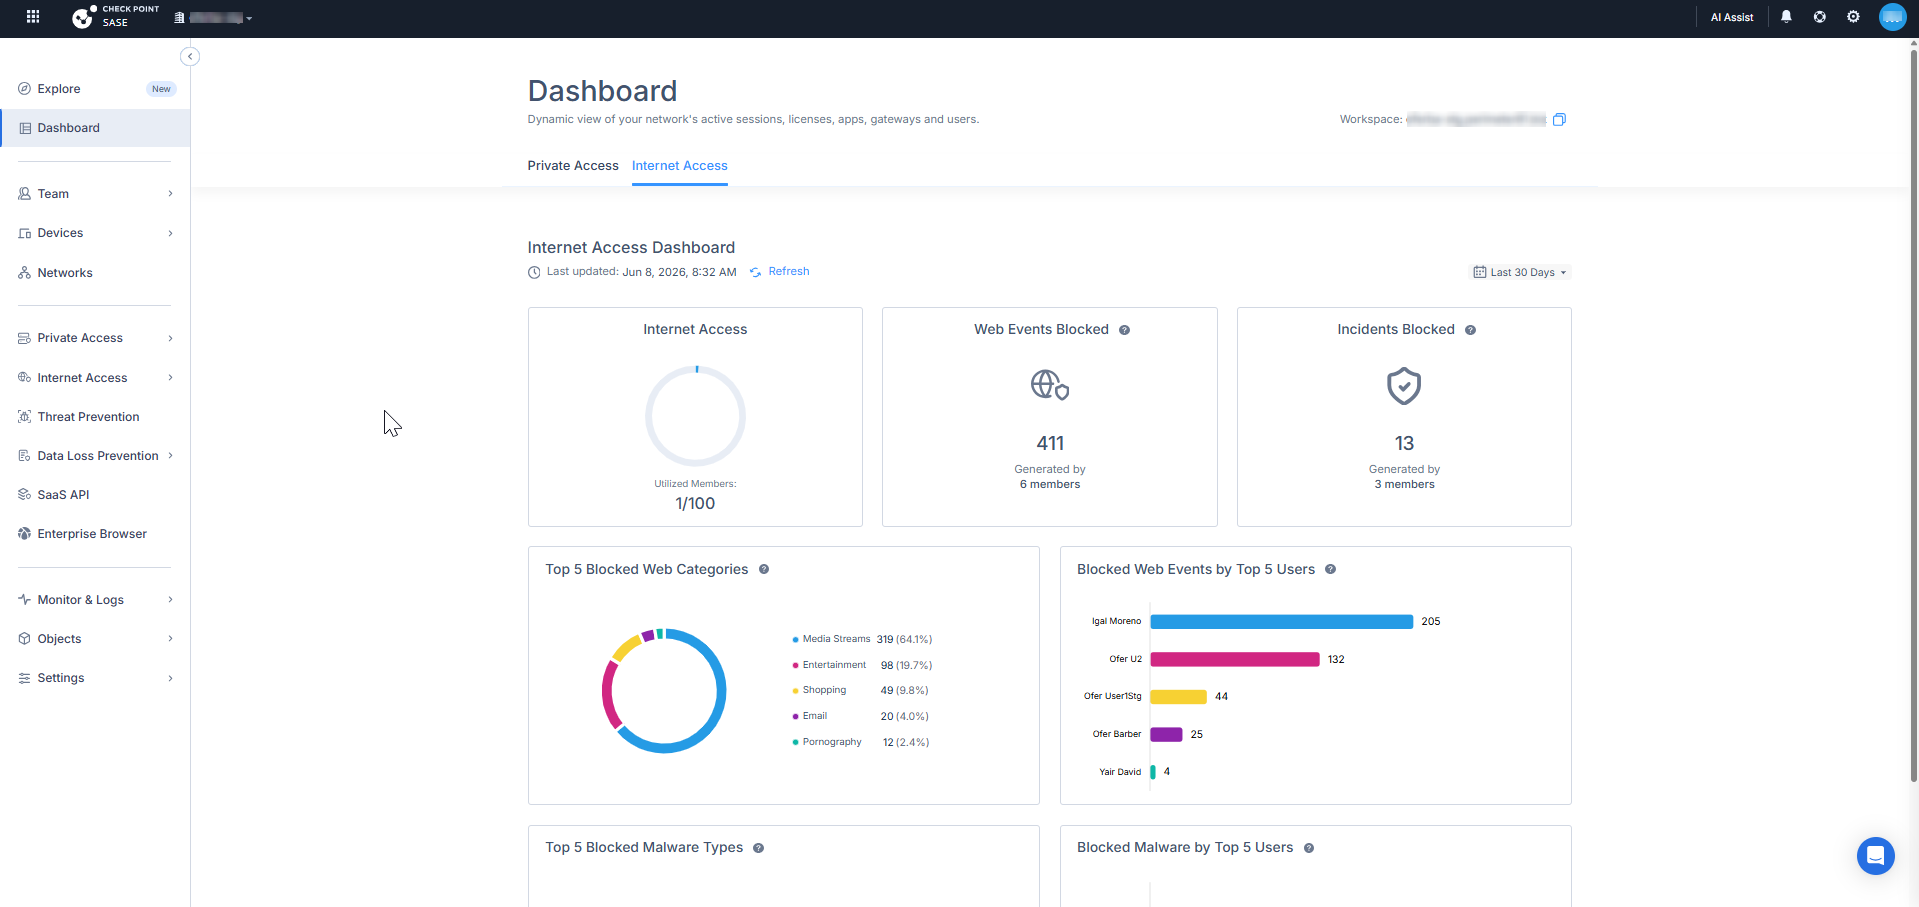
At the top right of the Internet Access Dashboard, you can select a time range filter.
Select any of these:
- Last 24 Hours
- Last 7 Days
- Last 30 Days
The Dashboard updates the displayed data based on the selected time range.
Internet Access
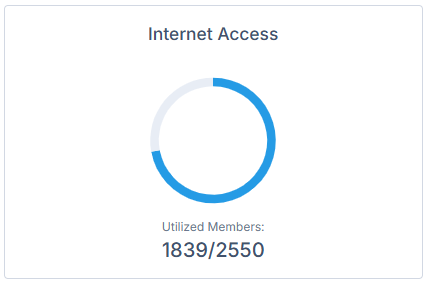
The Internet Access widget shows Internet Access license usage.
It displays the number of utilized members compared to the total number of licensed members.
Web Events Blocked
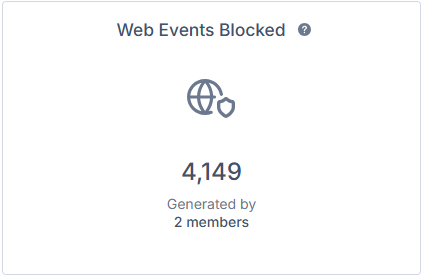
The Web Events Blocked widget shows the number of web events blocked. It also shows the number of members that generated the blocked events.
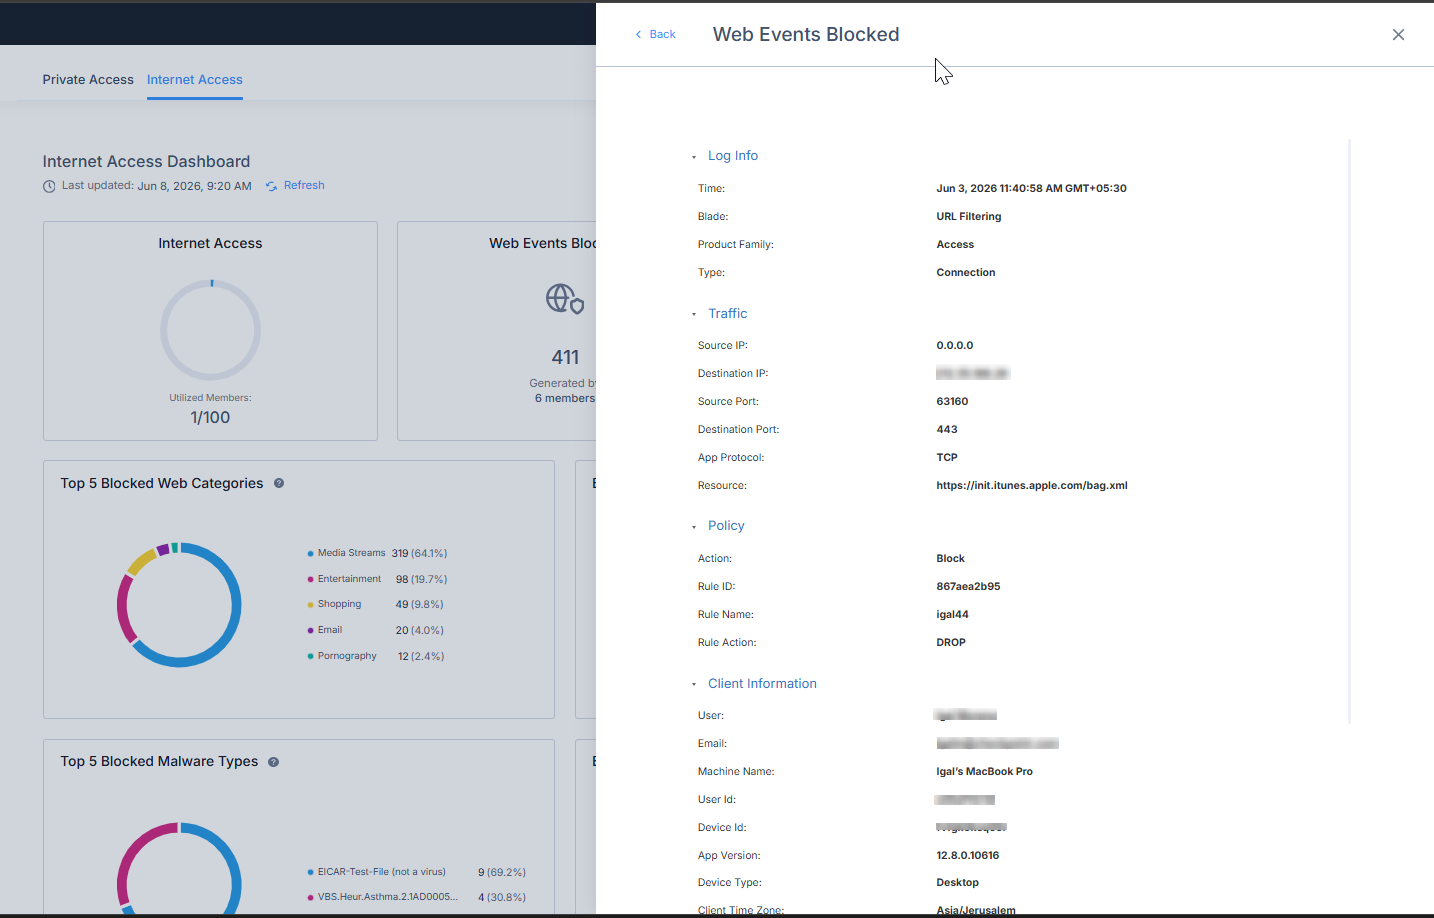
Click the widget to view a detailed table of the blocked web events.
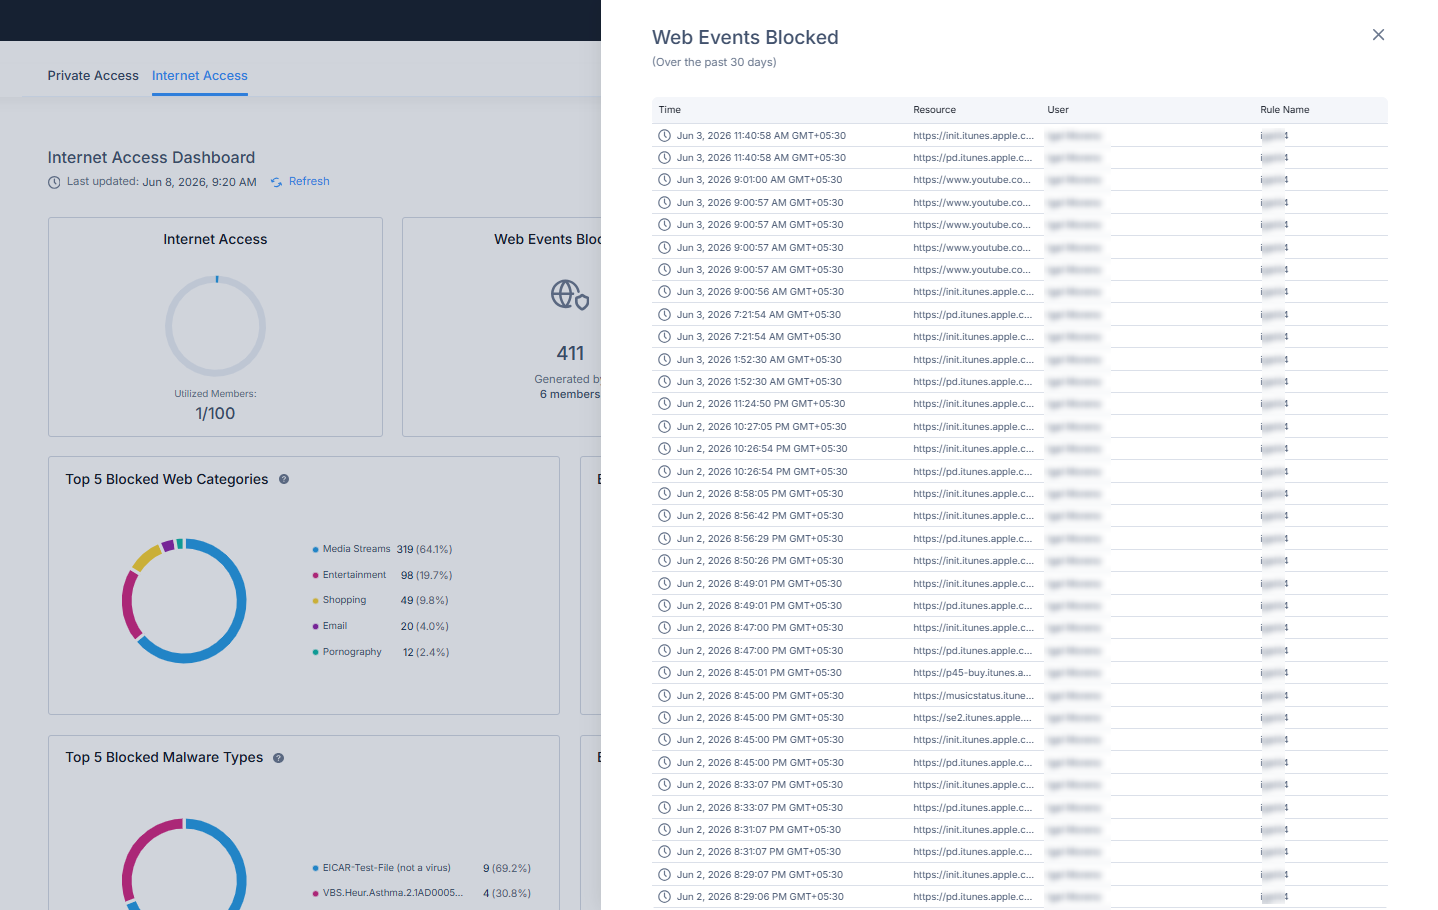
Selecting an event opens additional details.
Incidents Blocked
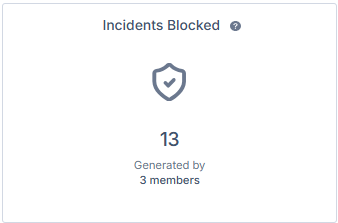
The Incidents Blocked widget shows the number of security incidents that were blocked during the selected time range. It also shows the number of members associated with the blocked incidents.
Click the widget to view a detailed table of blocked incidents.
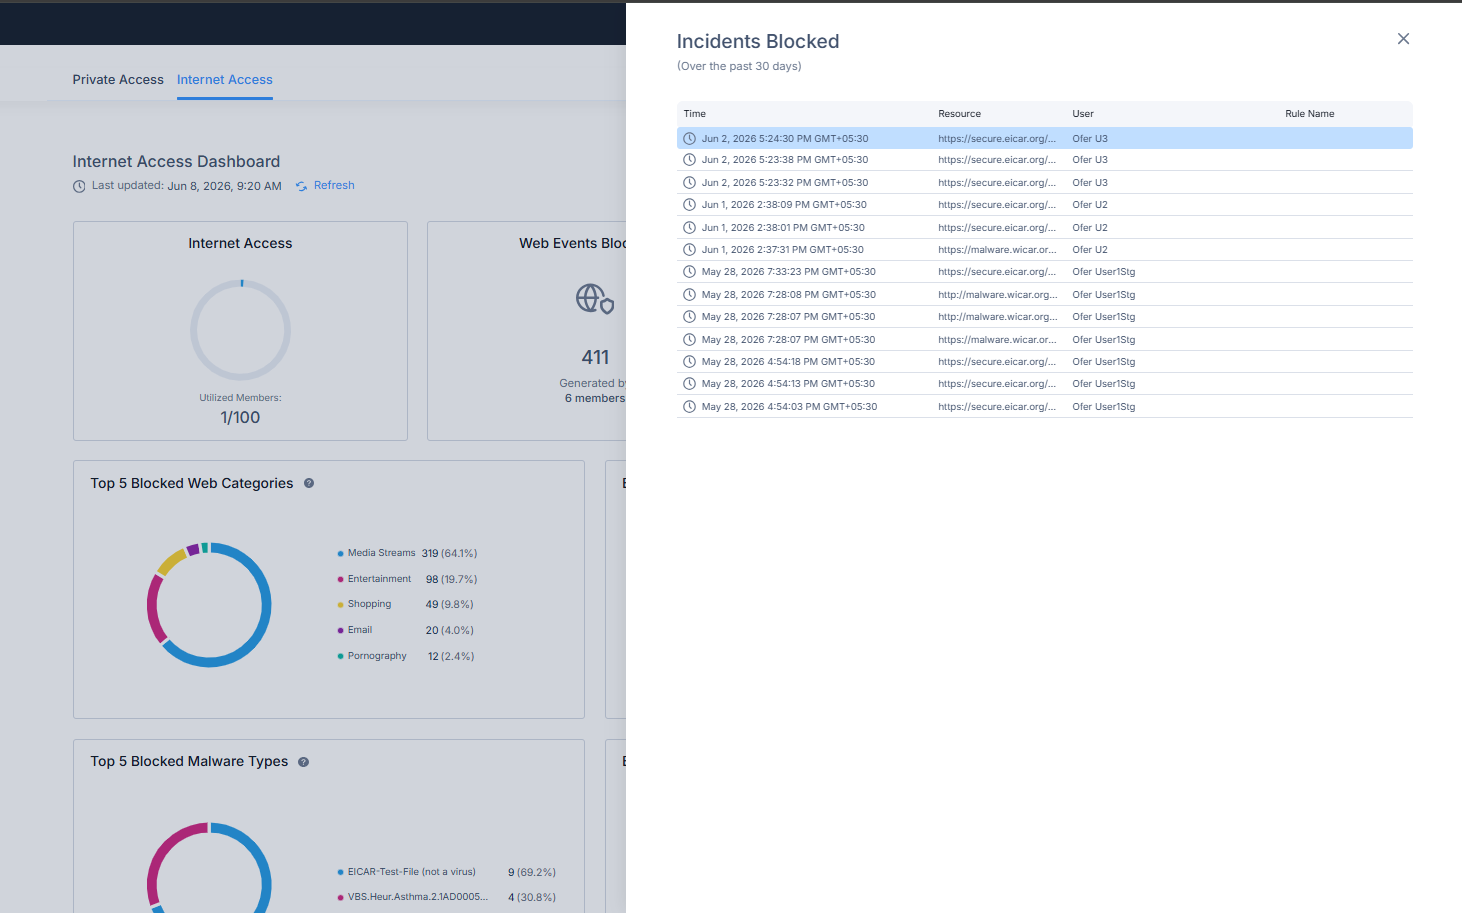
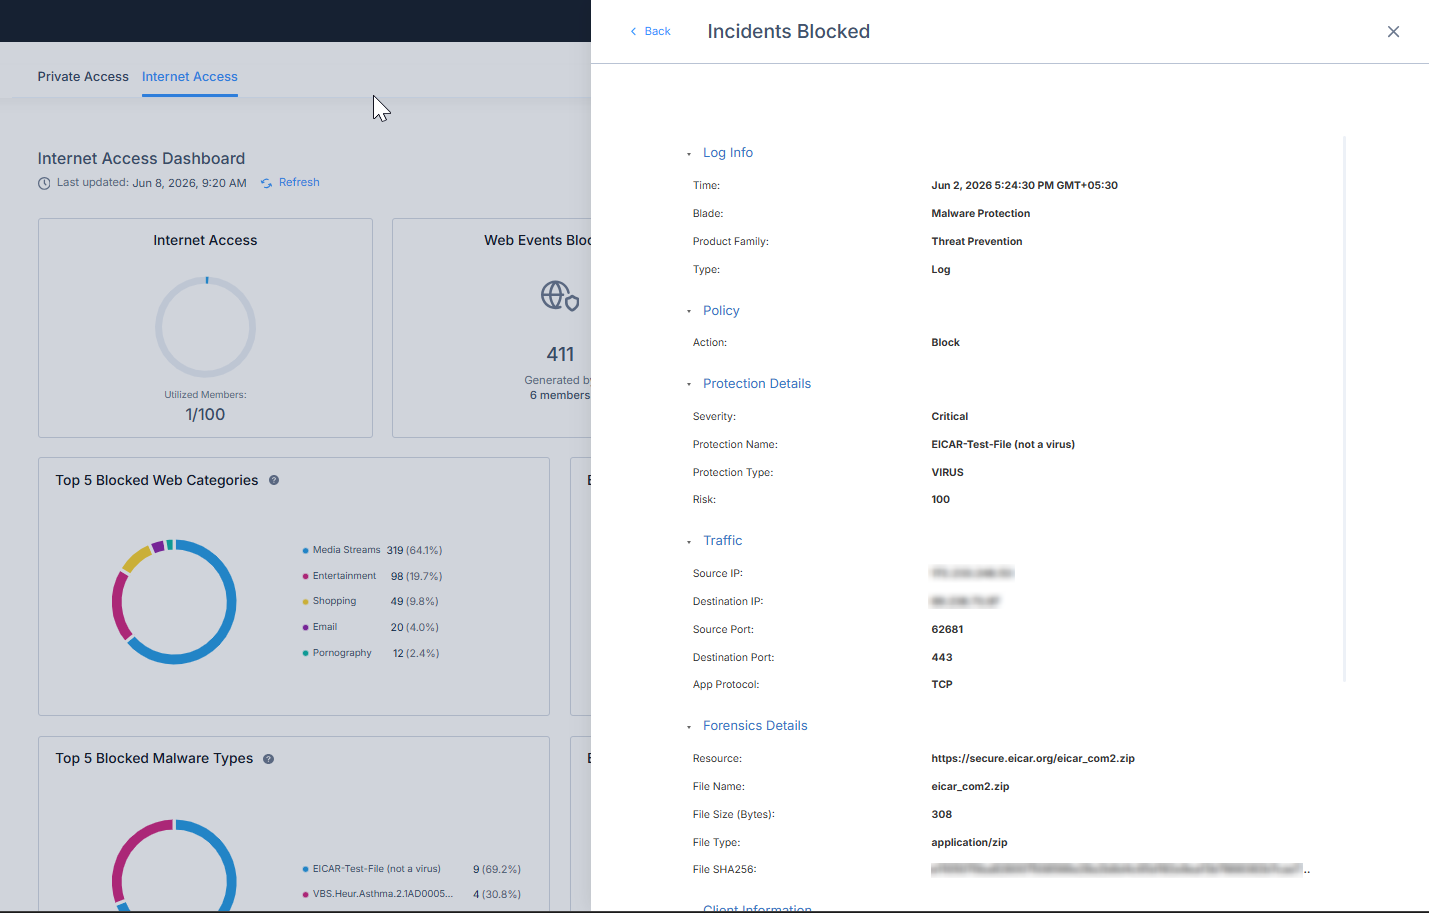
Selecting an incident opens additional details.
Top 5 Blocked Web Categories
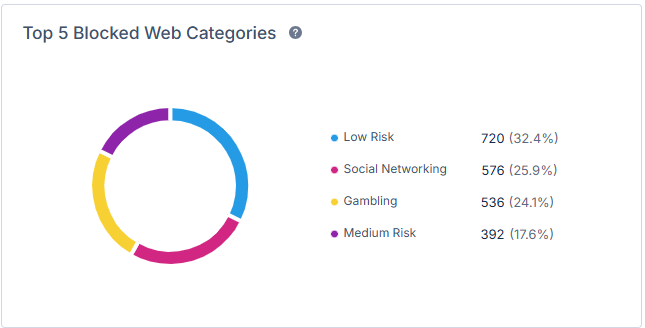
The Top 5 Blocked Web Categories widget shows blocked web events grouped by web category during the selected time range.
The chart shows the distribution of blocked events by category and percentage.
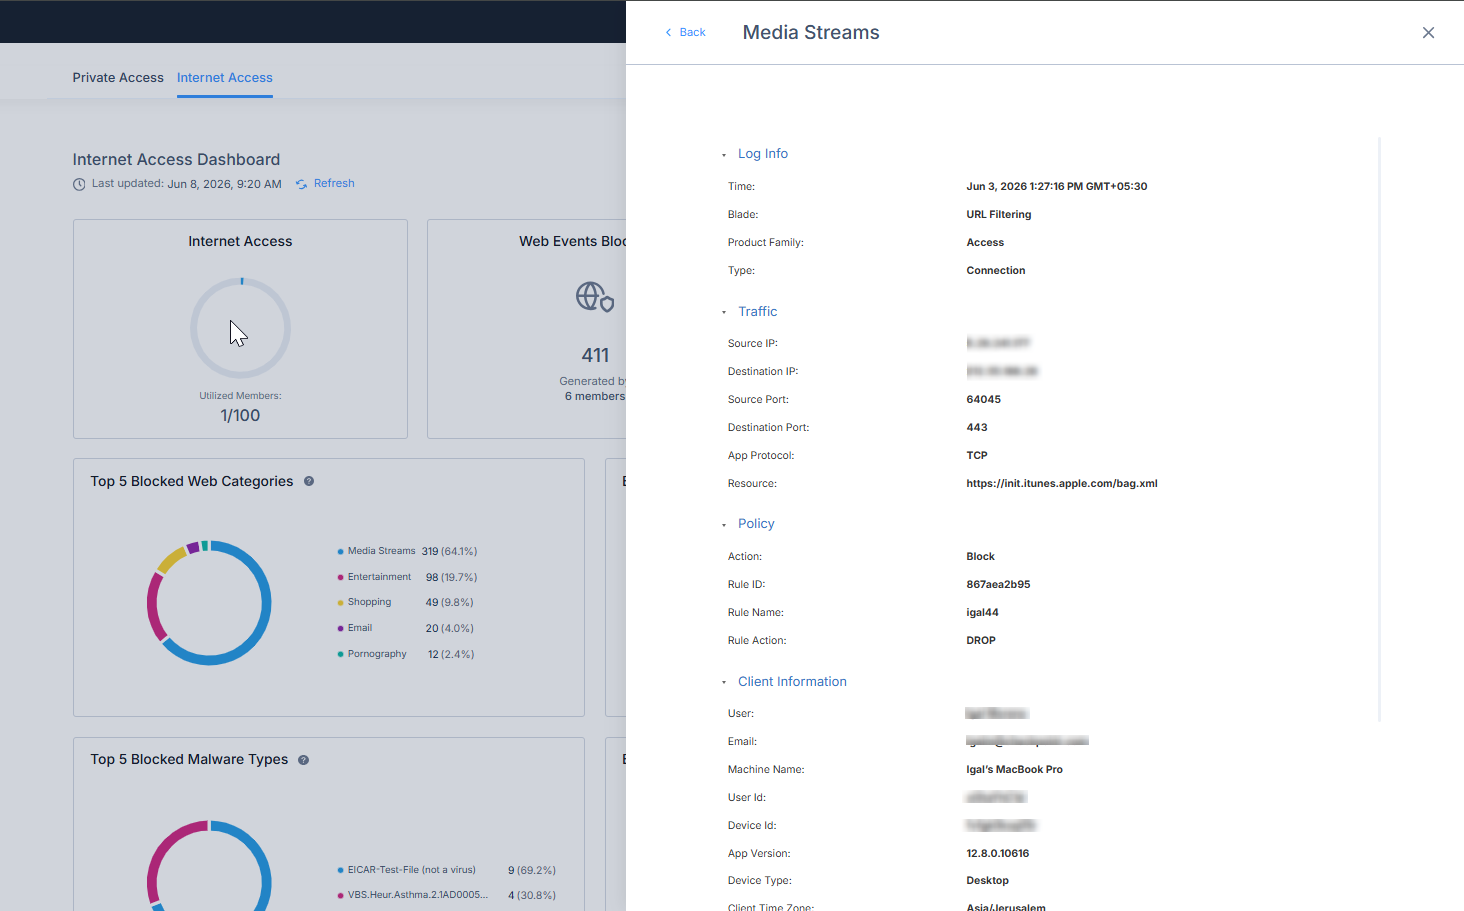
Selecting a category shows the related blocked web events.
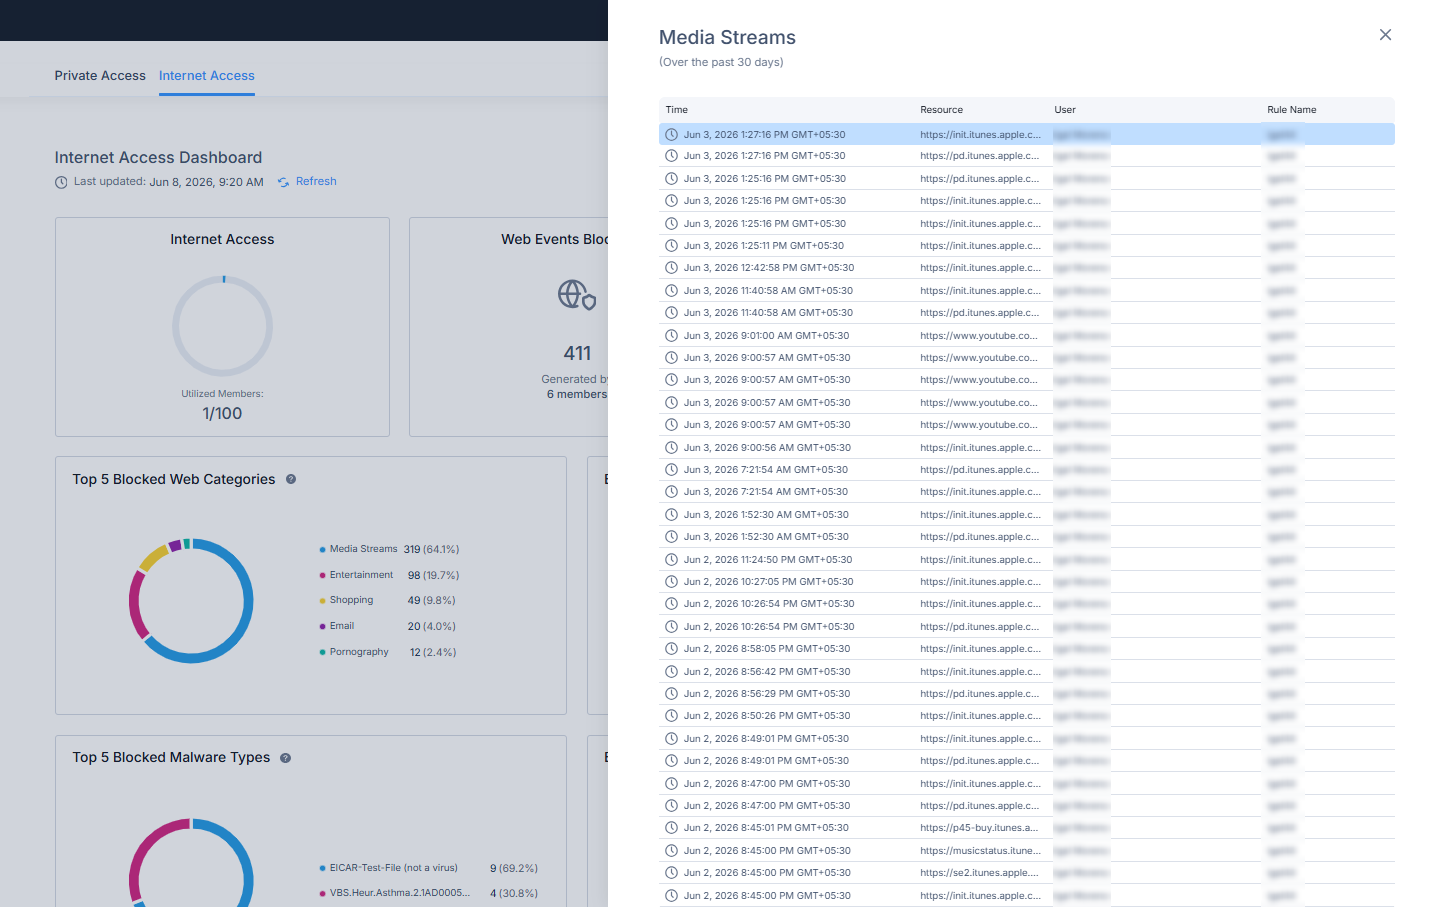
Selecting an incident opens additional details.
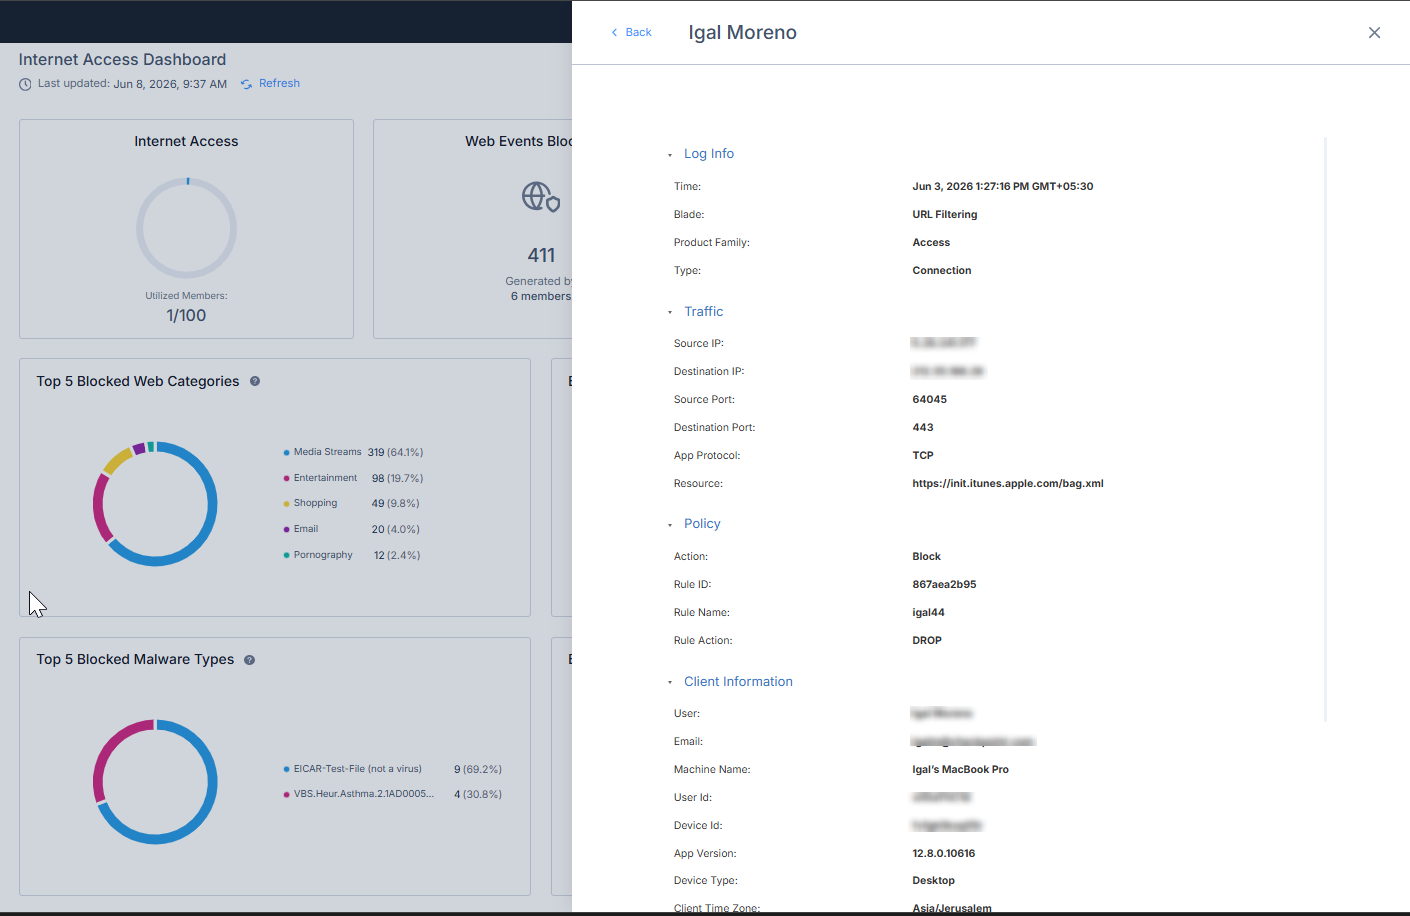
Blocked Web Events by Top 5 Users
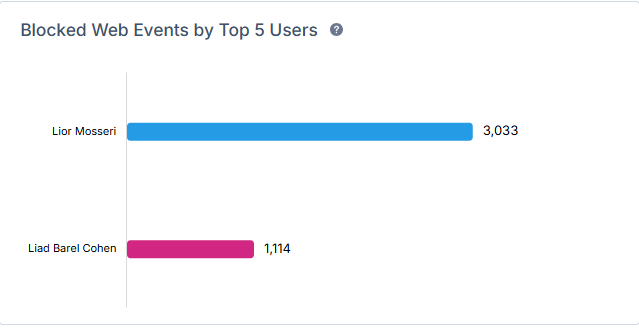
The Blocked Web Events by Top 5 Users widget shows the users with the highest number of blocked web events during the selected time range.
Selecting a user shows the blocked web events associated with that user.
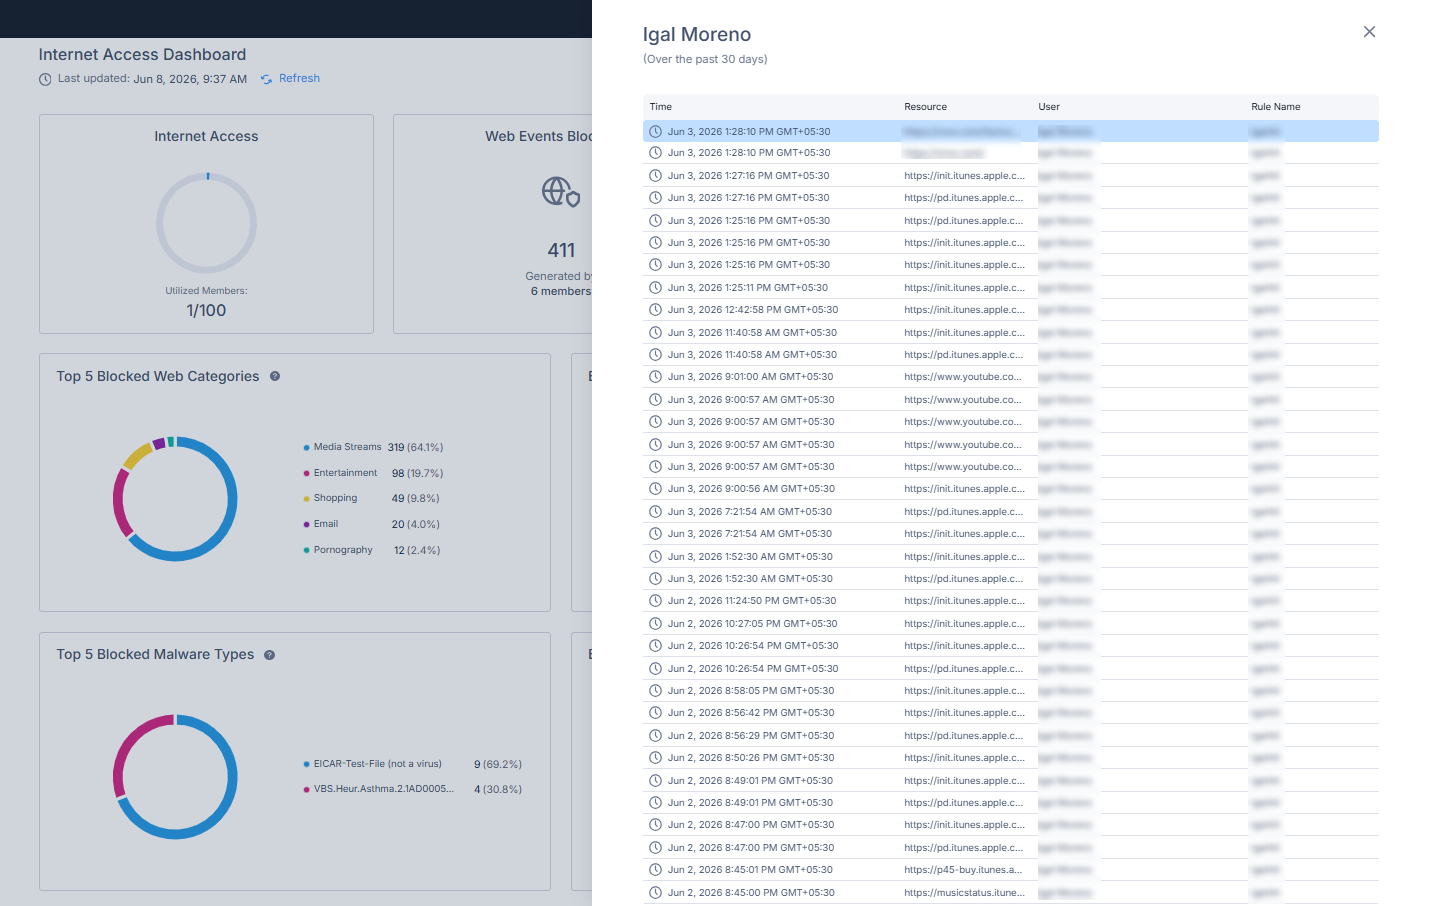
Selecting an event opens additional details.
Top 5 Blocked Malware Types
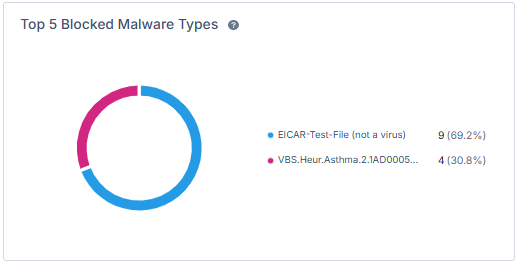
The Top 5 Blocked Malware Types widget shows blocked malware events grouped by malware type during the selected time range. The chart shows the distribution of blocked malware events by malware type and percentage.
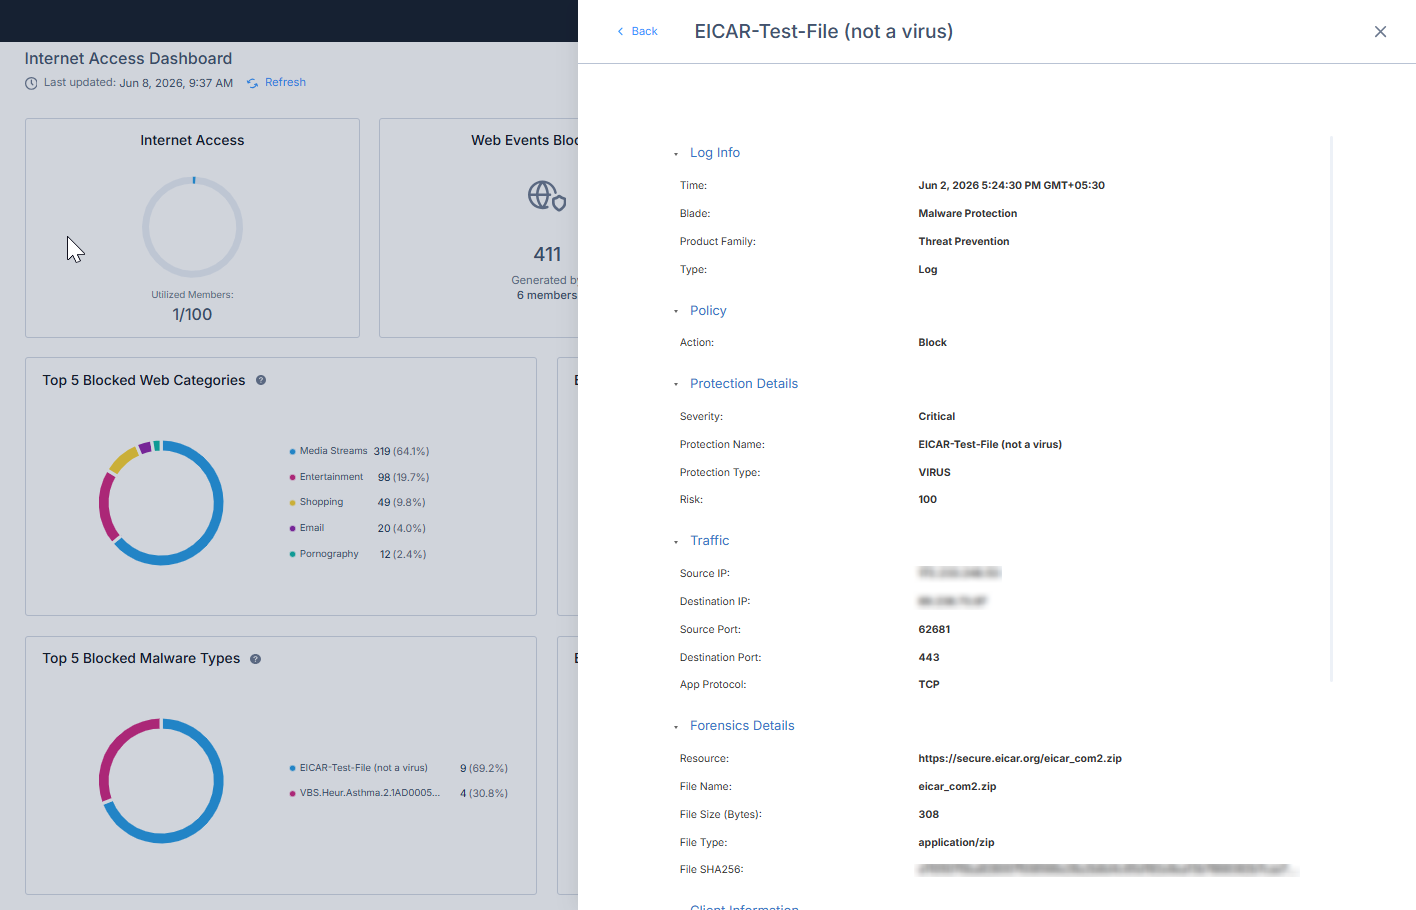
Selecting a malware type shows the related blocked
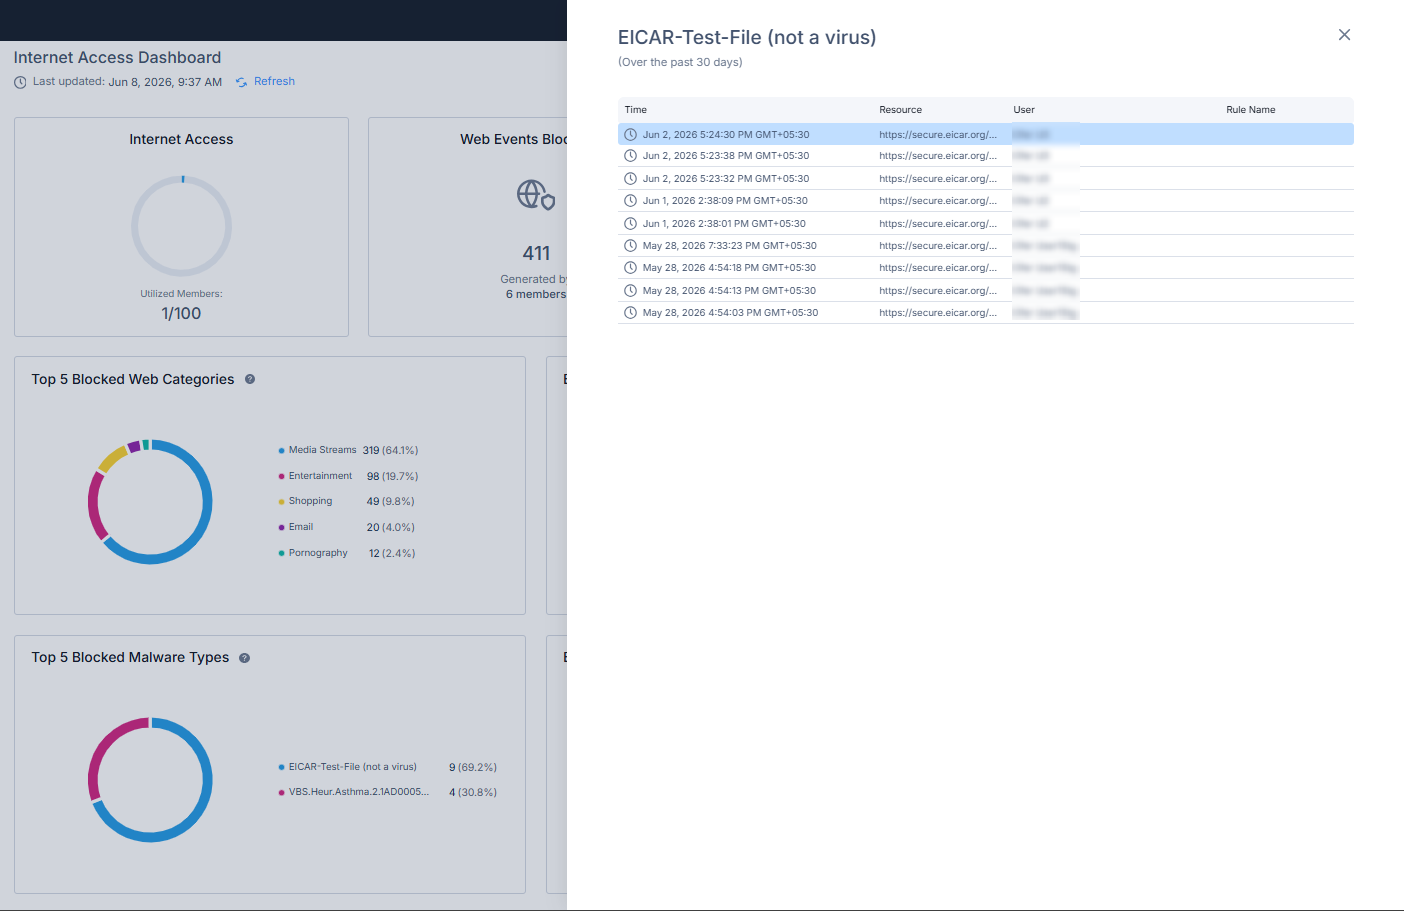
Selecting an incident opens additional details.
Blocked Malware by Top 5 Users
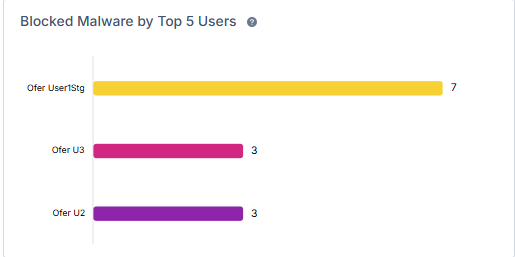
The Blocked Malware by Top 5 Users widget shows the users associated with the highest number of blocked malware events during the selected time range.
Selecting a user shows the blocked malware events associated with that user.
Selecting an incident opens additional details.