
Understanding Data Exporting to Splunk Cloud
- The Splunk Cloud integration in Check Point SASE is planned for deprecation.
- The integration stops working on December 1, 2026.
- Customers without an existing configuration no longer see this integration as an available option in the portal.
Recommended action: Migrate to the export option available in the Check Point Infinity Portal before December 1, 2026. This action prevents disruption to log forwarding.
The configuration steps remain available for reference while the integration stays active for existing customers.
This article describes how to configure Splunk Cloud. It is a software product that enables you to search, analyze, and view the data gathered from the components of your IT infrastructure or business. Splunk collects data from websites, applications, sensors, devices, and so on. You can configure Splunk Cloud to have full visibility of your Check Point SASE activities.
Setting up the Splunk Event Collector
The HTTP Event Collector (HEC) lets you send data and application events to a Splunk deployment over the HTTP and Secure HTTP (HTTPS) protocols. HEC uses a token-based authentication model. You can generate a token and then configure a logging library or HTTP client with the token to send data to HEC in a specific format. This process eliminates the need for a Splunk forwarder when you send application events.
After you enable HEC, you can use HEC tokens in your app to send data to HEC. You do not need to include Splunk credentials in your app or supported files.
Enabling an HTTP Event Collector
According to official Splunk documentation, Managed Splunk Cloud customers may need to contact Splunk support to perform this step.
- Click Settings > Data Inputs .
- Click HTTP Event Collector.
- Click Global Settings.
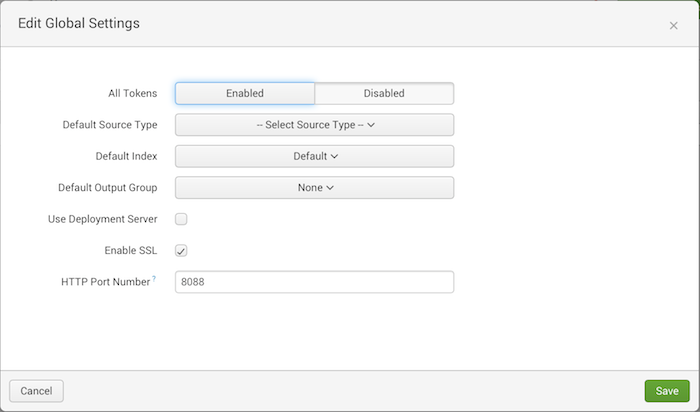
- In the All Tokens toggle button, select Enabled.
- To have HEC listen and communicate over HTTPS rather than HTTP, click the Enable SSL checkbox (This is enabled by default in Splunk Cloud and can be disabled in Splunk Enterprise only).
- Click Save.
Creating an Event Collector Token
- Click Settings > Add Data.
- Click monitor.
- Click HTTP Event Collector.
- In the Name field, enter a name for the token.
- Make sure indexer acknowledgment is disabled for this token.
- Click Next.
- Click Review.
- Confirm that all settings for the endpoint are what you want.
- If so, click Submit.
Configuring the Management Platform
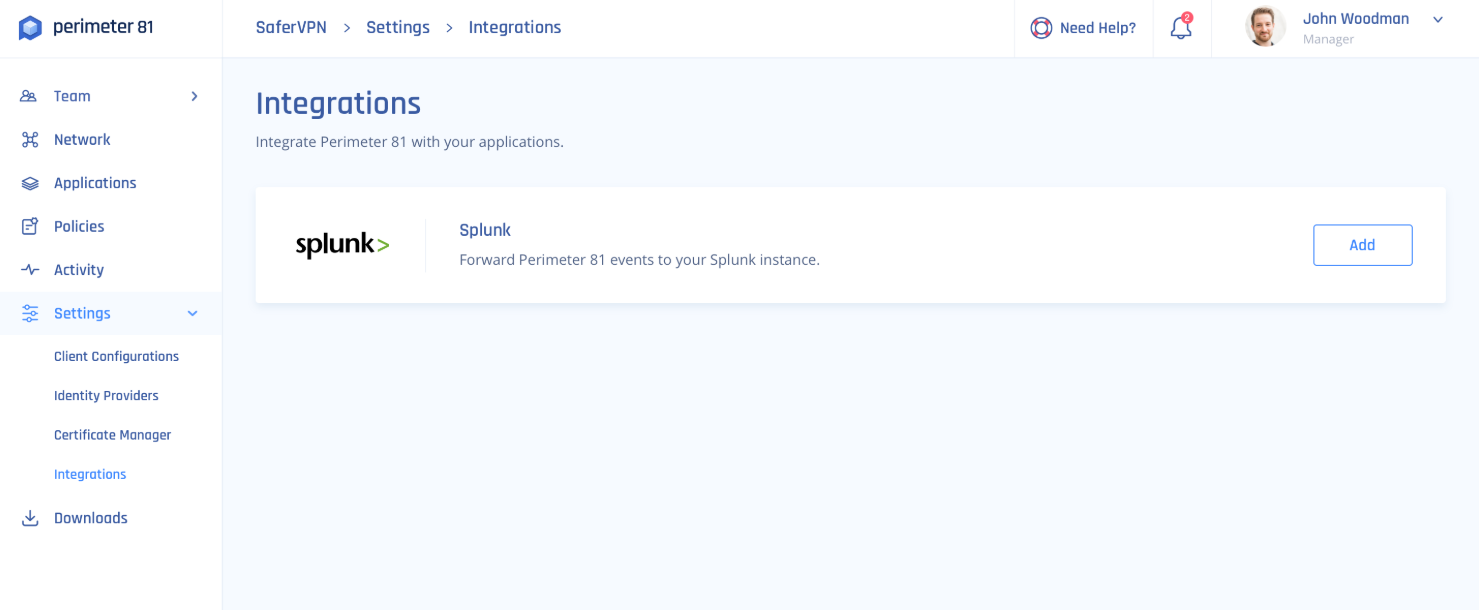
You need to configure the integration from the Check Point SASE side.
- Log in to your Check Point SASE Management Platform, and navigate to Settings, and select Add at the Splunk row.
- Fill in the following information:
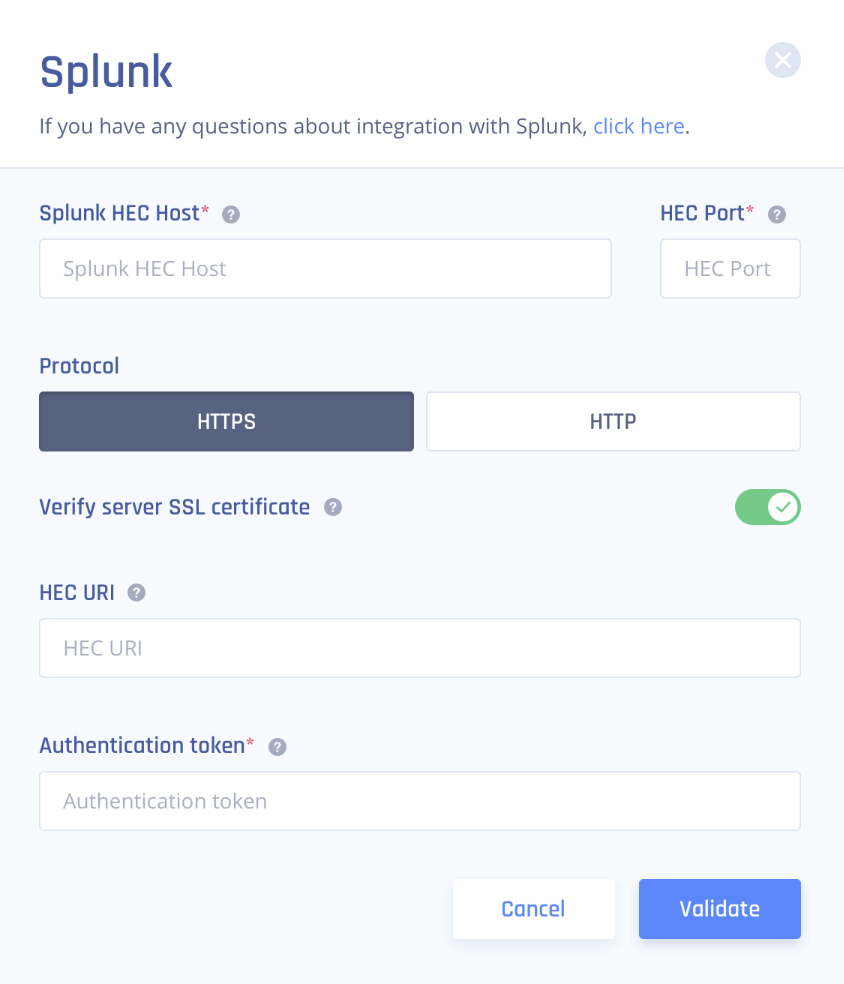
- HEC Host: Enter an appropriate value according to your Splunk tier (replace {hostname} with your Splunk server hostname).
Splunk Cloud (paid): inputs-<host>
Splunk Cloud (free-trial): <host> OR inputs.<host>
- HEC port: 8088 for Splunk Cloud free trial and 443 for Splunk Cloud paid
- Protocol: HTTP for a free trial and HTTPS for paid.
- Verify Server SSL Certificate (HTTPS only): If you are using a self-signed certificate disable SSL verification, however, if you are using a CA-signed certificate make sure to enable it.
- HEC URI: Filled automatically
- Authentication token: Enter the token you generated at Splunk.
3. Select Validate.
Recommendations
- Regularly review the integration settings to ensure continuous data flow between Check Point SASE and Splunk Cloud.
- In case of any error codes, refer to the provided error messages for guidance on resolving the issues
Troubleshooting
The following status codes have particular meaning for all HTTP Event Collector endpoints:
| HTTP status code ID | HTTP status code | Status message | Action required |
| 200 | OK | Success | None |
| 403 | Forbidden | Token disabled | Enable token at Splunk Web. |
| 401 | Unauthorized | Invalid authorization | Please make sure you entered a valid token. |
| 403 | Forbidden | Invalid token | Please make sure you entered a valid token. |
| 500 | Internal Error | Internal server error | Please contact our support team indication the error. We will examine the integration logs and further instruct you. |
| 503 | Service Unavailable | Server is busy | There are too many requests pending in the Splunk server queue. Please try again later. |
| 400 | Bad Request | Data channel is missing | Edit the token at the Splunk Platform and make sure to untick Indexer Acknowledgement. |
| 400 | Bad Request | Error in handling indexed fields | Please contact our support team indicating the error. We will examine the integration logs and further instruct you. |
Support Contacts
If you have any difficulties or questions, don't hesitate to contact Check Point SASE's support team. We offer 24/7 chat support on our website at sase.checkpoint.com, or you can email us at sase-support@checkpoint.com